You photograph a group, measure each bullet hole in LoadNode, and then tap Analyze with AI. Moments later, AI group analysis delivers something most precision reloaders have never had—not just a number, but a genuine diagnostic: a classification of the group’s shape, a plain-English summary, and targeted observations tied directly to the geometry and velocity data you actually collected. This guide explains exactly what the feature reads, what it returns, and what it deliberately will not do.
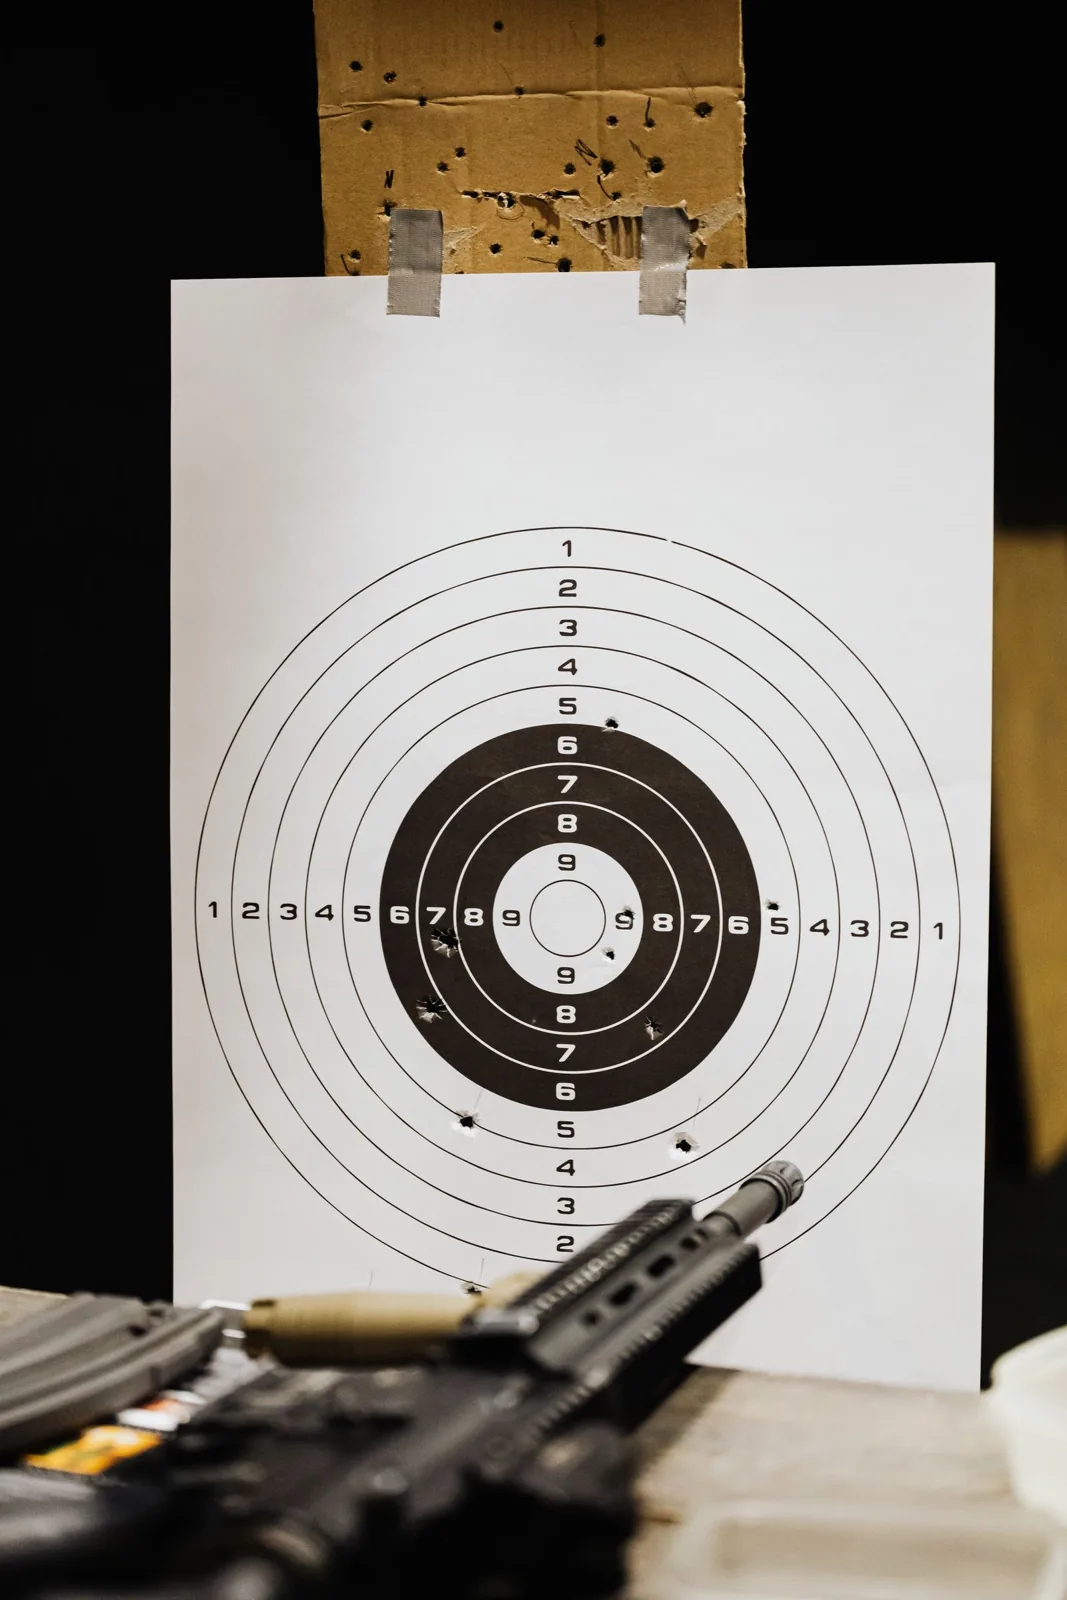
What AI Group Analysis Actually Reads
The AI does not work from a photograph. LoadNode first has you measure the target manually—placing a pin on each bullet hole to extract precise X/Y coordinates for every shot in the group. That geometric data, combined with the per-shot chronograph velocities you recorded during the session and any optional weather you entered, is all that gets transmitted. No images. No personal information. Only numbers.
Three categories of input feed the analysis:
Group geometry — the overall size (in inches, centimetres, or your preferred angular unit such as MOA), the mean radius of the cluster, the ratio of vertical spread to horizontal spread, and whether any single hole sits clearly apart from the rest. A group that strings twice as tall as it is wide carries fundamentally different diagnostic meaning than one that radiates equally in all directions.
Velocity correlation — does each shot’s vertical position on the target track its recorded muzzle velocity? A bullet launched significantly faster than the session average will arrive higher downrange. When the AI can draw a statistical line between fast shots landing high and slow shots landing low, it has identified a velocity–dispersion relationship—exactly what standard deviation in muzzle velocity is already signalling in your chronograph data.
Session conditions — temperature, wind speed, or lighting you entered are folded in as context. A crosswind reading gives the AI reason to interpret horizontal spread differently than it would in calm conditions.
The 7 Pattern Types AI Group Analysis Returns
After processing shape and velocity data, the tool classifies the group into one of seven pattern types:
- Round — roughly symmetric scatter with no dominant axis. Often reflects normal random dispersion with no single identifiable cause.
- Vertical — significantly more spread along the up/down axis than left/right. The primary suspect is muzzle-velocity variation; recoil management inconsistency is a close second.
- Horizontal — the group strings left to right. Common contributors include crosswind, parallax not dialled to the actual target distance, trigger-technique inconsistency, or off-axis recoil.
- Diagonal — a tilted string. This pattern can point to barrel–resonance effects interacting with a consistent torque vector, or stock and bedding influences.
- Flyer — one shot sits clearly separated from an otherwise compact cluster. The AI distinguishes a true outlier from general scatter.
- Mixed — no single axis dominates; dispersion is multi-directional with no clean pattern.
- Inconclusive — the data is present but either too sparse or too ambiguous for a reliable classification. More shots are needed before drawing any conclusion.
Each result comes with two to four specific observations drawn directly from your numbers—for example, “your vertical spread is 2.3× your horizontal spread” or “your three fastest shots correspond to the three highest holes”—giving you something concrete to examine rather than a generic recommendation.
Non-Load Suggestions: What to Investigate, Not What to Change
Alongside its observations, AI group analysis returns one to four actionable suggestions—all non-load. This is the most deliberately constrained aspect of the feature. The suggestions never touch charge weights, powder types, bullet seating depth, or any recipe variable. They point instead to independently verifiable causes:
- Technique — recoil management, consistent head position, and grip pressure are invisible in chronograph data but visible in group shape.
- Optics — parallax dialled short of or past your actual distance, or a reticle with slight cant, can both produce systematic point-of-impact shift that looks like a genuine dispersion pattern.
- Rest and position — bag fill, bipod cant, or sling tension under load can each introduce repeatable directional bias.
- Wind — even a modest 5 mph crosswind moves a bullet horizontally at 100 yards more than many reloaders expect, particularly with lighter projectiles.
- Component consistency — primer seating depth uniformity and case trim length affect ignition and pressure consistency without appearing clearly in any individual velocity reading.
- Sample size — when three or five shots are insufficient to support a firm conclusion, the AI will say so and recommend shooting a larger group before acting on a pattern.
Why no load advice at all? Because load selection is not what this tool is for. Choosing a charge weight requires a current published manual and the judgment of an experienced reloader familiar with their specific components and firearm. AI group analysis is designed to help you understand patterns in the data you have already collected—not to prescribe what goes in a case. That boundary is fundamental to how LoadNode operates, and every analysis ends with a reminder to consult your published reference data before changing anything.
Pro Access, Privacy, and Monthly Credits
When you run an analysis, only the numeric group geometry, per-shot velocity values, and any weather you chose to include are transmitted. No photograph is uploaded. No personal identifiers are attached to the request.
AI group analysis is a LoadNode Pro feature. LoadNode Pro (a one-time purchase, not a subscription) includes ten analyses per month—enough to cover multiple sessions or ladder tests across a month of range work. Extra credit packs are available and never expire, so you can stock up before a heavy testing season without worrying about a cut-off date.
Before running your first analysis, a few companion guides will make the results easier to read. The mean radius vs. group size guide explains why mean radius describes a group’s centre tendency more reliably than extreme spread alone. The MOA group measurement guide covers how angular size scales with distance. If the analysis flags velocity variation as a likely contributor, the SD and ES guide explains what those figures mean in practice.
Once you have run a few sessions through LoadNode, the pattern names and observations become intuitive—and the notes you accumulate start to compound across range days in a way that a standalone ballistics calculator cannot replicate.
Handloading is an adult activity done at your own risk. LoadNode is a logbook and analysis tool — it never provides load data. Always develop loads from current published manufacturer data and work up safely.